



When CPU spikes to 100%, your entire PC grinds to a halt. Games stutter into unplayable slideshows, audio cracks, windows freeze when you click them, and cooling fans spin like a jet turbine on takeoff.
Excessive processor usage happens because of software runaway loops (buggy background apps or services), power plan misconfigurations (where the operating system won’t enter idle sleep states), or hardware thermal throttling (where an overheating CPU drops its clock speed so low that basic tasks overwhelm it). Anyway, if you’re dealing with high or 100% CPU usage on your Windows PC, here’s a diagnostic workflow to troubleshoot the issue, pinpoint the bottleneck, and bring your processor use back to normal.
- 0% to 5% (Idle): On a desktop with background apps closed.
- 10% to 30% (Light Work): Browsing a few web pages, typing documents, or listening to music.
- 40% to 70% (Moderate Work): Streaming video, multitasking across a bunch of browser tabs, or light photo editing.
- 70% to 100% (Heavy Load): 3D rendering, video encoding, game compiling, or playing modern AAA titles.
If CPU stays above 80% to 100% on desktop, the system has an active issue that needs immediate attention.
What Does 100% CPU Usage Mean in Windows?
The CPU is the part of your PC that executes every instruction from Windows and your apps. The usage percentage shows how much of its capacity is busy at that moment. At 100%, the processor has no spare capacity, so new tasks have to wait their turn, and that waiting is the lag you encounter.
A burst to 100% is normal sometimes. When you launch a high-demand program, export a video, play a game, or install an update, these tasks temporarily max out the processor. The problem starts when the CPU load stays high while you are doing nothing.
| ✅ Normal | 🚨 Needs fixing |
|---|---|
| A short spike when you sign in or open an app | High usage with no app open, lasting some minutes |
| Full load during a game, render, file compression, or build | High usage that continues after the game or job has closed |
| A Defender scan or Windows Update run once and finish | The same scan or update loop every day |
| The PC stays responsive, and temperatures are stable | Loud fans, a hot chassis, freezing, crashes, or fast battery drain |
1. Apply the Hidden “IDLEDISABLE” Power Fix (Task Manager Bug)
If Task Manager consistently shows 100% CPU usage, but third-party tools like Microsoft Sysinternals Process Explorer show it’s 98% idle, you’ve encountered a known Windows power profile bug.
Certain motherboard software like MSI Dragon Center/MSI Center, VR software (Meta/Oculus runtime), and aggressive “Gaming” modes flip a hidden Windows registry flag named IDLEDISABLE. This prevents the operating system from letting the processor enter low-power idle states (C-states). Windows misinterprets this as 100% utilization, pins your clock speed at maximum, and cooks the hardware.
You can reset this flag from the command line:
- Right click the Start menu icon and select Terminal (Admin) on Windows 11 or PowerShell (Admin) / Command Prompt (Admin) on Windows 10.
- Copy and paste the following command, then hit Enter:
PowerCfg /SETACVALUEINDEX SCHEME_CURRENT SUB_PROCESSOR IDLEDISABLE 000
- Now, copy and paste this second command to apply the change immediately, and press Enter:
PowerCfg /SETACTIVE SCHEME_CURRENT
Note: Terminal will not print a confirmation message and will simply return to a blank prompt line. Wait 20–30 seconds, and watch Task Manager. In most cases, CPU usage and temperatures drop right away after this action.
2. Restart Your PC and Verify Task Manager Update Speed
Before digging into deep system services, rule out basic display hangs and stuck transient threads.
- Reboot: Click Start > Power > Restart (don’t select Shut Down if Windows Fast Startup is enabled, as shutting down can save the kernel state to disk along with lingering glitches; a proper Restart clears the kernel session completely).

- Check Update Speed: In Task Manager, click View on the top menu bar (or the settings gear), go to Update speed, and verify it is set to Normal or High. If this was accidentally set to Paused, Task Manager can freeze on a single snapshot in time that may have caught a temporary 100% load spike.
3. Identify and Terminate Rogue User Processes
When a stray app locks an execution thread into an infinite loop, this single process can max out one or more processor cores.
- Press Ctrl + Shift + Esc to launch Task Manager.

- Go to the Processes tab, then click the CPU column header to sort processes in descending order (highest usage at the top).
- If you see a standard program like Google Chrome, Discord, or Steam consuming 40% to 90% of the processor while idle:
- Web Browsers: Faulty extensions, mainly rogue ad-blockers, crypto extensions, or translation scripts, frequently corrupt browser memory. Open the browser’s built-in task manager (Shift + Esc in Chrome or Edge) to see which tab or extension is spinning out.

- Stuck Apps: Select the offending program in Windows Task Manager and click End Task.
- Web Browsers: Faulty extensions, mainly rogue ad-blockers, crypto extensions, or translation scripts, frequently corrupt browser memory. Open the browser’s built-in task manager (Shift + Esc in Chrome or Edge) to see which tab or extension is spinning out.
Never terminate critical core processes like
explorer.exe, winlogon.exe, csrss.exe, or System unless you are deliberately testing a desktop reload. Ending foundational tasks will crash your machine with a Windows Blue Screen of Death (BSOD) or log you out of the session.4. Track Down Hidden Resource Hogs with Resource Monitor
Task Manager groups background tasks, which can hide sub-processes that consume excessive CPU cycles.
- Press Windows Key + R, type
resmon, and press Enter to open Resource Monitor. - Switch to the CPU tab.
- Check the Average CPU column.

- Resource Monitor shows every background worker, thread count, and handle. If an unnamed script, secondary launcher, or orphaned installer is thrashing your processor, it will be revealed here even if it’s hidden under a parent container in Task Manager.
- Right click the runaway process and select End Process.
5. Check Stuck Windows Services (Svchost and WMI Provider Host)
Windows background services sometimes get caught in endless polling or validation loops.
Fixing WMI Provider Host (WmiPrvSE.exe)
WMI Provider Host connects software queries to your operating system. High CPU usage here usually means another app is flooding WMI with bad requests instead of a problem with WMI itself.
- Press Windows Key + X and select Event Viewer.
- Go to Applications and Services Logs > Microsoft > Windows > WMI-Activity > Operational.
- Look for events tagged with Error.
- In the event details below, find the ClientProcessId (PID) number.
- Open Task Manager, go to the Details tab, sort by PID, and find that number to identify the culprit. Common offenders include motherboard RGB controllers, old peripheral software, or macro engines. Update or uninstall that specific application.
Fixing Stuck Service Host (svchost.exe) Tasks
If a Service Host process runs wild, expand its entry in Task Manager to reveal the exact service driving up the usage.
- Windows Update: If Windows Update hangs while searching for updates, open Settings > Windows Update and check for errors. You can restart the engine by opening Command Prompt (Admin) and typing
net stop wuauserv, thennet start wuauserv. - SysMain (Superfetch): On PCs with old drives or heavily fragmented storage pools, SysMain’s background caching can stall. Press Win + R, type services.msc, and locate SysMain. Right-click it, click Stop, and see if CPU usage drops back to normal.
6. Disable Unnecessary Startup Apps and Bloatware
Programs allowed to boot alongside Windows run constant background listeners, telemetry agents, and update monitors that collectively steal CPU overhead.
- Open Task Manager (Ctrl + Shift + Esc) and click the Startup apps tab.
- Look through the list and pay attention to items labeled High under the Startup impact column.

- Disable unnecessary startup items like third-party voice chats, game storefront launchers, audio enhancements (e.g., Waves MaxxAudio), and OEM peripheral hubs.
- Restart your system to boot into a lean user environment.
7. Check for Thermal Throttling
High CPU usage isn’t always caused by heavy workloads; often, the processor gets downclocked due to excessive heat.
When an Intel or AMD chip exceeds its maximum operating thermal ceiling (typically 95°C to 100°C), the onboard thermal monitor cuts the core multiplier to save the silicon from burning out. Your CPU might drop from its normal 3.60 GHz or 4.50 GHz boost clock all the way down to 0.79 GHz. At 800 MHz, opening a single browser tab requires 100% of the processor’s crippled capacity.
- Download a free hardware sensor tool like HWMonitor or Core Temp.
- Look at Package Temperatures while idle. If your CPU remains between 85°C and 100°C with no games or demanding tasks, the cooling system has failed.
- For Desktop AIO Liquid Coolers: A sudden jump to 100°C with no tasks in process usually means the AIO pump has died, or coolant permeation has formed an air pocket in the block.
- For Air Coolers & Laptops: Heatsinks clogged with dust or dried-out, cracked thermal paste prevent heat transfer to the radiator fins. Clean the dust with compressed air or reapply thermal grease.
8. Reset Your Power Plan to Balanced
Aggressive power profiles can lock processor performance states into maximum overdrive, generating a lot of heat and preventing frequency scaling.
- Press Windows Key + R, type
powercfg.cpl, and hit Enter. - If your system is set to a custom manufacturer plan (like MSI High Performance or Ultra Performance), switch it back to Balanced (recommended).

- Click Change plan settings next to Balanced, then click Restore default settings for this plan.
- This re-enables Dynamic Frequency Scaling and lets your CPU automatically clock down when the workload is light.
9. Run an Offline Malware and Cryptojacker Scan
Modern malicious software often includes “cryptojackers”—unauthorized background miners that steal the processing power to mine cryptocurrency. Smart cryptojackers are programmed to monitor system hooks. Right when they detect you opened Task Manager, they kill their own thread to hide, then spin back up after you close Task Manager.
- Click Start, type Windows Security, and press Enter.
- Go to Virus & threat protection > Scan options.

- Select Microsoft Defender Antivirus (offline scan) and click Scan now.
- Your computer will reboot into a clean, unhosted recovery environment where hidden rootkits and mining scripts cannot intercept the scanner or hide behind system APIs.
10. Repair System Files with DISM and SFC
If core Windows DLLs (dynamic link libraries) become corrupted following an improper shutdown or interrupted OS update, system services will get trapped in an endless loop trying to run broken code.
- Press Windows Key + X and launch Terminal (Admin) or Command Prompt (Admin).
- Run the deployment image servicing tool first to download clean system images from Microsoft servers:
DISM /Online /Cleanup-Image /RestoreHealth
- Once DISM reports completion, run the System File Checker to scan and replace damaged local files:
sfc /scannow
- Restart the computer after verification completes.
11. Perform a Clean Boot
If 100% or high CPU usage is not fixed, confirm if third-party background software is fighting Windows for hardware calls.
- Press Windows Key + R, type
msconfig, and press Enter. - Click the Services tab.
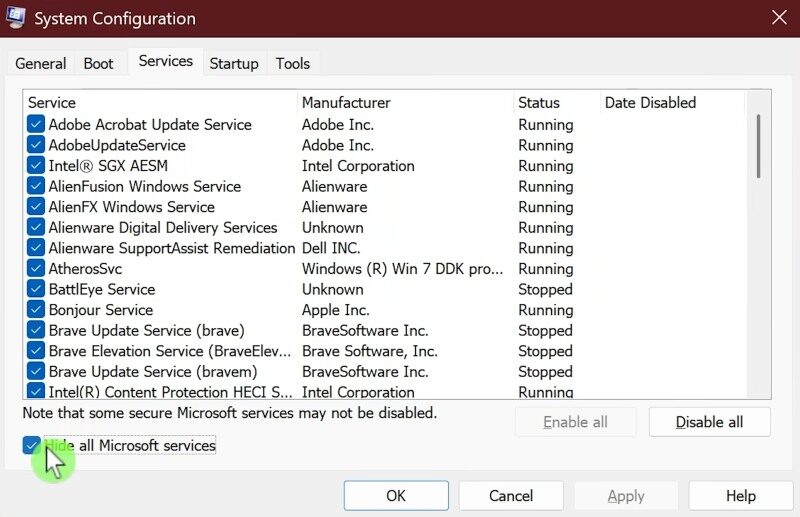
- Check the box at the bottom that says Hide all Microsoft services (critical: never skip this).
- Click Disable all.
- Switch to the Startup tab, click Open Task Manager, and ensure all startup items are disabled.
- Restart your PC.
If your processor settles down after the restart, one of the disabled third-party services caused the spike. Turn them back on in small groups until you find the troublesome app, then either update it or remove it completely.


